Chapter 12 Linear Regression
§ 12.1 linear Equations
- Slope-Intetrcept: `y=mx+b`
- `b` is the y-intercept, `(0,b)`, a starting point for the graph.
`m` is the slope, the average rate of change, `"rise"/"run"=(Delta y)/(Delta x)=(y_2-y_1)/(x_2-x_1)`
Example: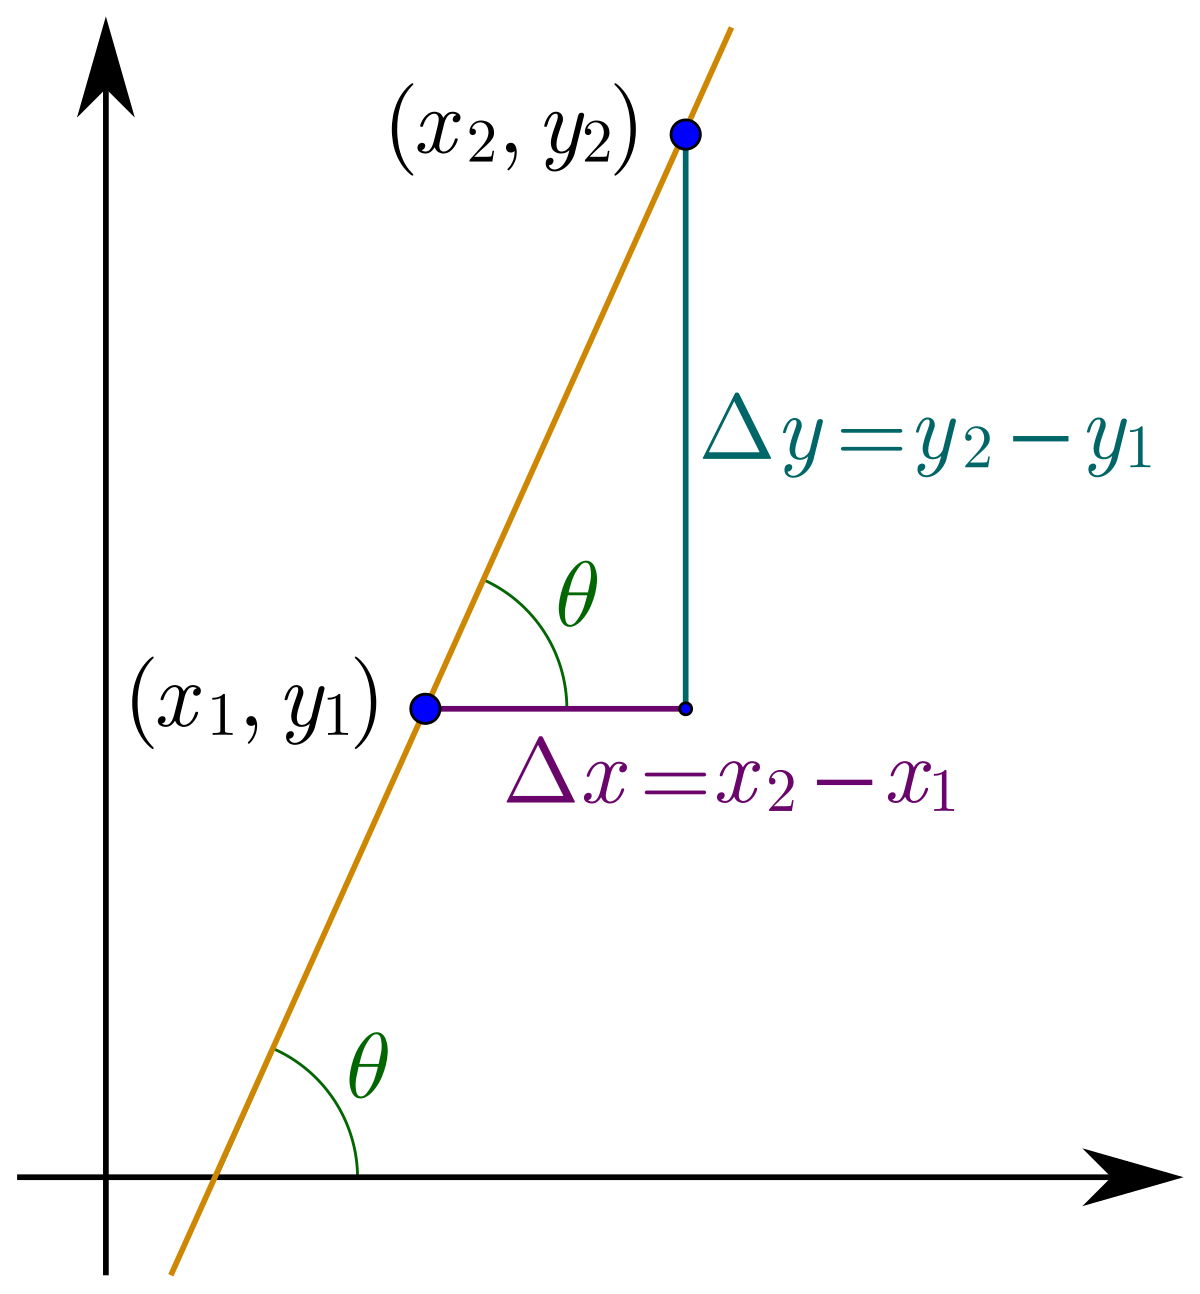
- And more details
- Given two points, find the equation of a line between them.
- Interpteting slope
§ 12.2 Scatter Plots
- Scatter Plots
- Decide which variable is independent. The will be the first column, the x-values.
- The other variable is then assumed to depend on the other. This will be the second column, the y-values.
- Plot the points on paper or with a graphing utility such as a spreadsheet or StatKey's Two Quantitative Variable app.
- Be sure that the chart and axes are well labeled.
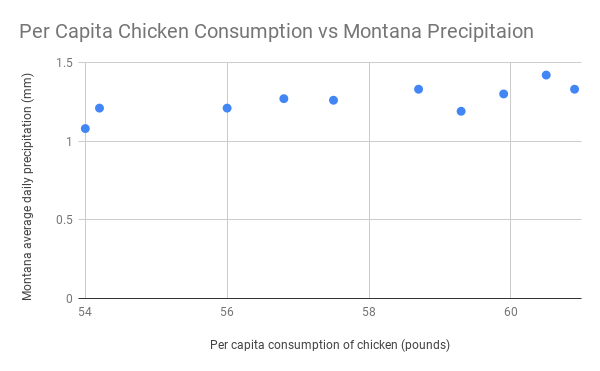
2000 2001 2002 2003 2004 2005 2006 2007 2008 2009 Per capita consumption of chicken (US)
Pounds (USDA)54.2 54 56.8 57.5 59.3 60.5 60.9 59.9 58.7 56 Precipitation in Montana
Avg Daily Precipitation (mm) (CDC)1.21 1.08 1.27 1.26 1.19 1.42 1.33 1.3 1.33 1.21 Correlation: 0.774714
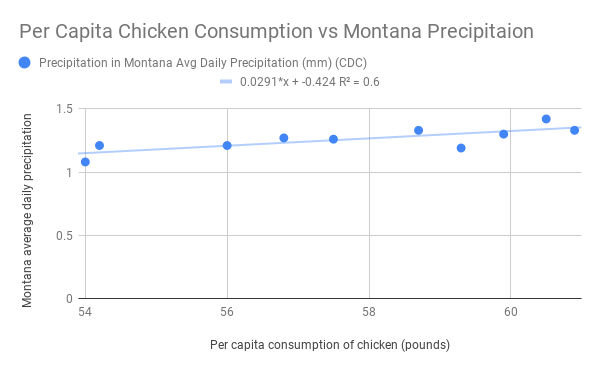
§ 12.3 Regression Lines
- Aka Least Squares Lines
- Slope and intercept are calculated to minimize the errors in approximation from the line to the y-values.
- `r=` the correlation coefficient
which tells us if the correlation is positive or negative, strong or weak. - `r^2=` the Coefficient of Determination
which tells us the percent of variation in the dependent variable that can be explained by the dependent variable. - Examples:
- Interpreting slope:
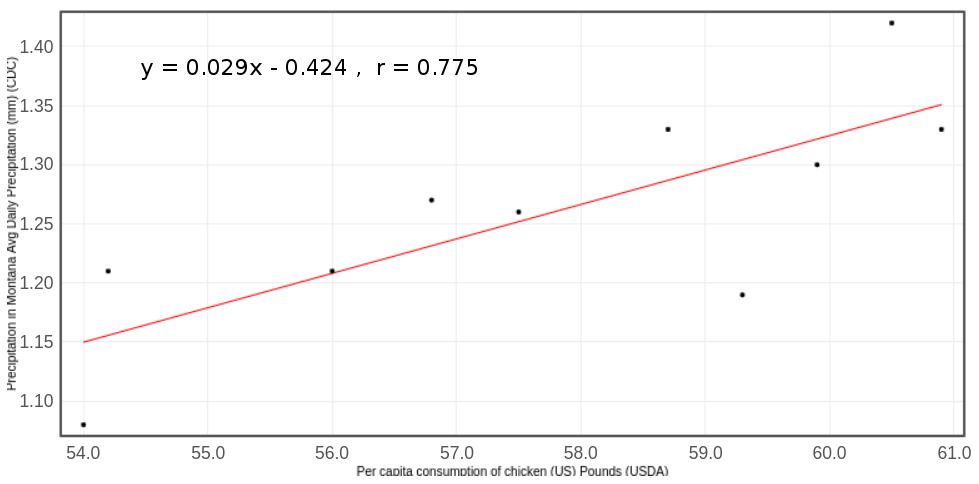
In this case, `m=0.029` or `29/1000`, which means that for each additional pound of chicken the average US resident eats, Montana will get 0.029 mm more of precipitation per day, on average. - Interpreting the y-intercept:
In this case, `b=-0.424`, doesn't make any sense. If the average person ate NO chicken, then Montana would get less than no daily precipitation on average. I suppose that could mean no rain and that state is drying up at a rate of `-0.424 " mm/day"`? - Interpreting the correlation coefficient `r`:
Here `r=0.775`, since it is positive we know that as chicken consumption is increasing, then so is average daily precipitation in Montana. Since `|r|` is closer to 1 than zero, there is some correlation between the variables. That is, there is some correlation between an increase in chicken consumption and an increase in Montana's average daily precipitation. However, this does not tell us why this might be the case. - Interesting data sources
- Regression Examples