Chapter 8
§8.1 & §8.2 Confidence Intervals for a Single Population Mean
Objectives (text)
- Calculate and interpret confidence intervals for estimating a population mean.
- Understand the roles of sample size, confidence level, and spread on the margin of error.
- Population vs Sample
- Parameter vs Statistic
- Point Estimates:
- The sample mean `barx` is an estimate for the population mean `mu`.
- The sample proportion `p'` is an estimate for the population proportion `p`.
- The sample standard deviation `s` is an estimate for the population standard deviation `sigma`.
- Interval Estimates:
- The average age of college students is between 21.24 and 29.56.
The average age of a college student is within 4.16 years of 25.4. - The proportion of females attending college is between 43% and 63%.
The proportion of female college students is within 10% of 53%.
- The average age of college students is between 21.24 and 29.56.
- Sampling Distribututions
aka a histogram of sample means,
or a histogram of sample proportions.
Anatomy of a Confidence Interval


`"margin"=("right"-"left")/2`
`"point estimate"=("right"+"left")/2`
OR
`"left"="point estimate"-"margin"`
`"right"="point estimate"+"margin"`
Examples: (StatKey)
- Average Body Temperature: `mu`

Interval estimate: `98.048^circ F < mu < 98.468^circ F` or `(98.048^circ F, 98.468^circ F)`
Point estimate: `barx = 98.258^circ F` and `EBM=0.210^circ F`
`mu = 98.258^circ F +- 0.210^circ F` - Average Restaurant Tip: `mu`

`$3.478 < mu < $4.232` or `($3.478, $4.232)`
`barx=$3.855` and `EBM=$0.377`
`mu = $3.855 +- $0.377`
Interpretation:
We are 95% confident that the average daily tip at this restaurant is between $3.48 and $4.23.
§8.3 Confidence Intervals for a Population Proportion
Objectives (text)
- Calculate and interpret confidence intervals for estimating a population proportion.
- Understand the roles of sample size, confidence level, and spread on the margin of error.
Examples: (StatKey)
- Proportion of peanuts in a can of mixed nuts: `p`

Interval estimate: `0.42 < p < 0.62` or `(0.42, 0.62)`
Point estimate: `hat p = p' = 0.52` and `EBP=0.10`
`p = 0.52 +- 0.10` - Proportion of home game wins for a soccer team: `p`

`0.492 < p < 0.675` or `(0.492, 0.675)`
`hat p = p' = 0.583` and `EBP=0.091`
`p = 0.583 +- 0.091`
Interpretation:
We are 95% confident that proportion of home game wins for this soccer team is between 49.2% and 67.5%.
Interpreting the Confidence Level
A realization of 50 confidence intervals attempting to capture that actual population mean.

The confidence level is NOT a chance of success!
Which of the following statements best describes a 95% confidence level?
- 95% of people's body temperatures are in this interval.
- There is a 95% chance that a randomly selected person will be in the interval.
- There is a 95% chance that the average human body temperature will be in this interval.
- 95% of similar intervals will contain the actual mean human body temperature.
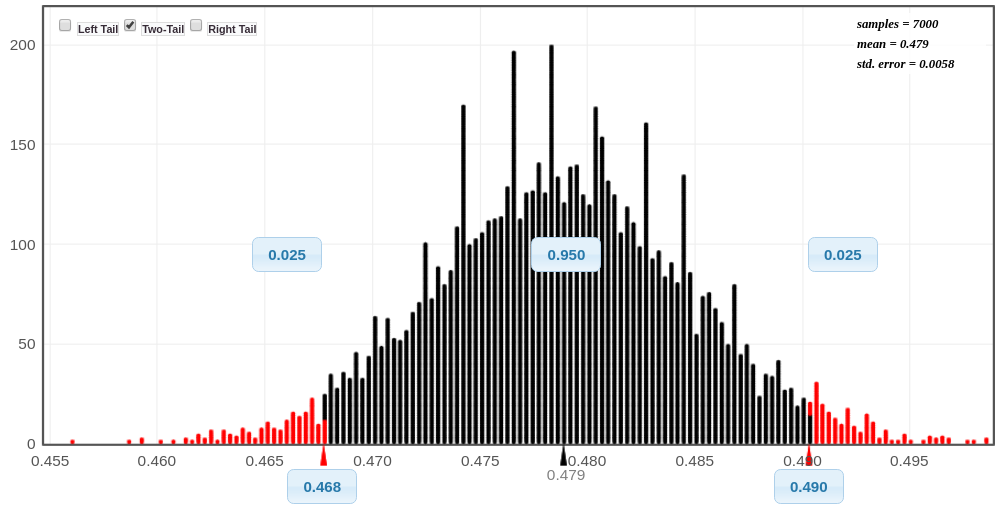
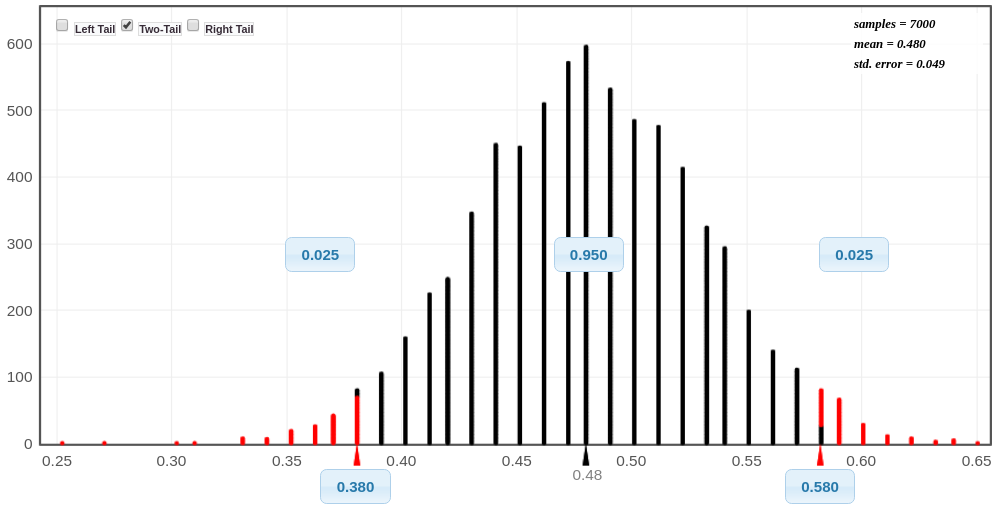
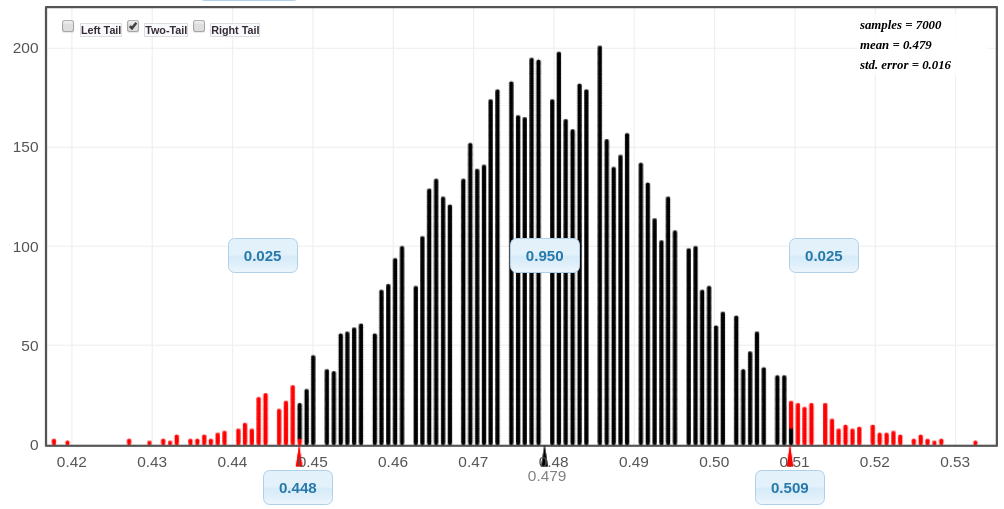
Sample Size Matters
Notice that as the sample size increases, the standard deviation of the sampling distribution decreases.
Female College Students: `x=48`, `n=100`, and the standard error is about 0.049.
Female College Students: `x=479` , `n=1000`, and the standard error is about 0.016.
Female College Students: `x=3501` , `n=7313`, and the standard error is about 0.0058.