StatKey is a great app for analyzing data.
For analyzing a single data set, select the One Quantitative Variable option.
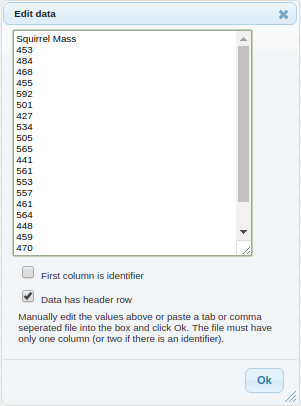
Then select Edit Data. Delete the data there, type a title for your data set, and paste your data in. The title and each number in your data list should be on a new line, no commas. Uncheck the option for First column is identifier. Select OK.

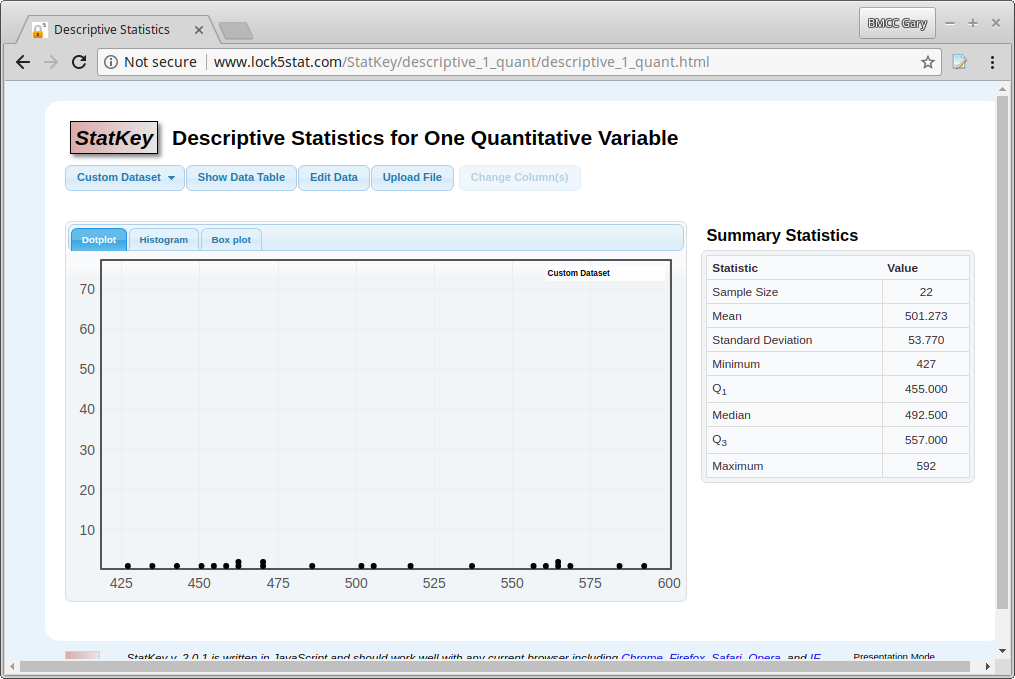
You should now have a dot plot and the summary statistics. You can use the tabs above the plot to switch to a Histogram or a Box Plot.

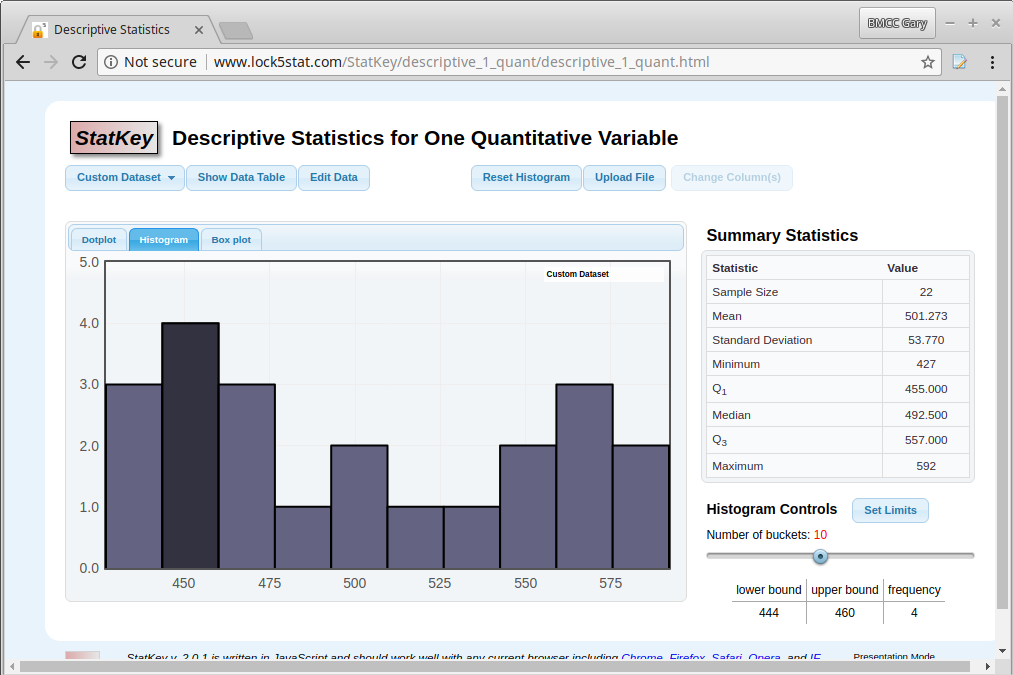
In the screenshot below, notice the histogram has more settings and information on the bottom right of the window.

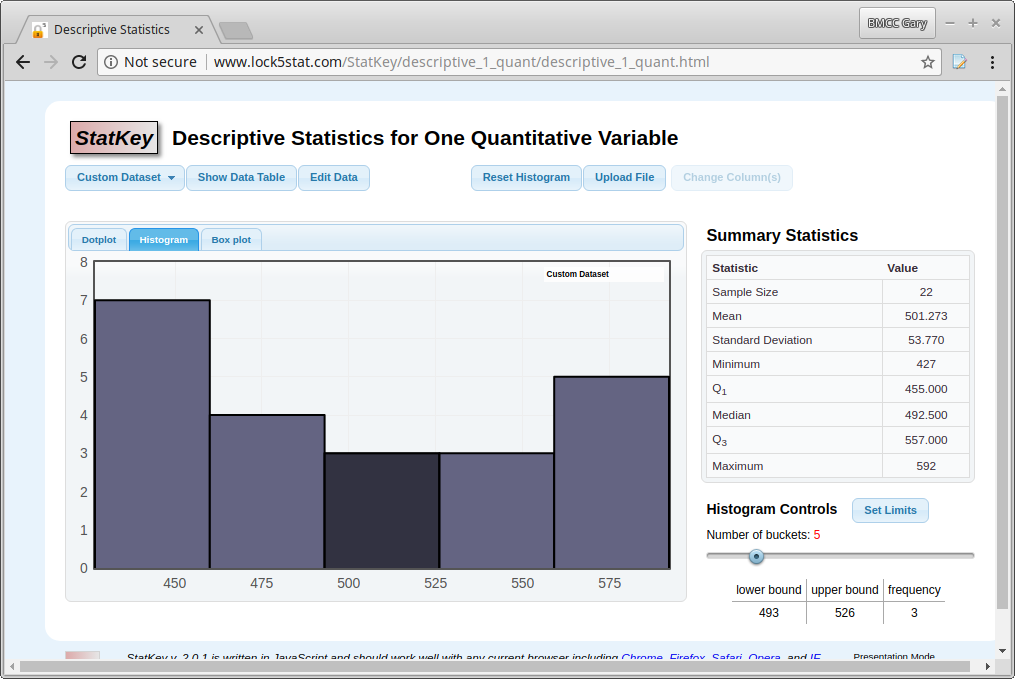
Pointing to a column will tell you the left and right boundaries and height of that column.
You can also adjust the number of buckets and set the left and right limits.

Enjoy!
