MTH213
Foundations of Elementary Math 3
Fun with Statistics.

Chapter 7 Statistics
§ 7.1 Collecting and Graphing Data
Descriptive Statistics part 1
- Types of Graphs
- Bar or Column Charts
- Pareto Charts
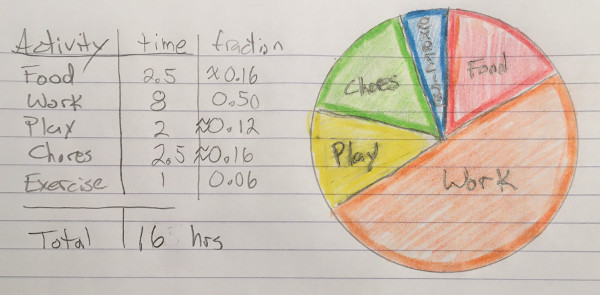
- Pie Charts
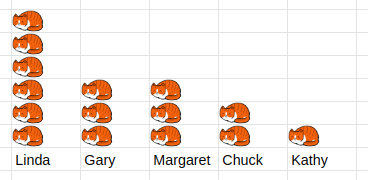
- Pictographs
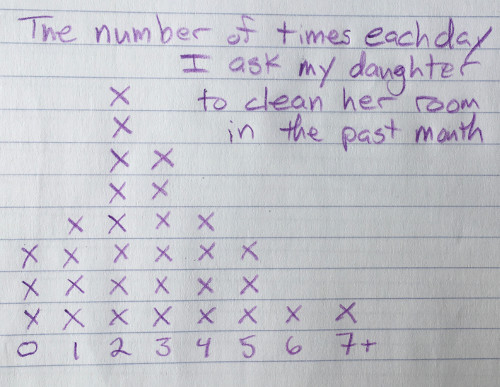
- Line Plots aka Dot Plots
- Stem and Leaf Plots
- Histograms and Frequency Table
- Relative and Cumulative frequency
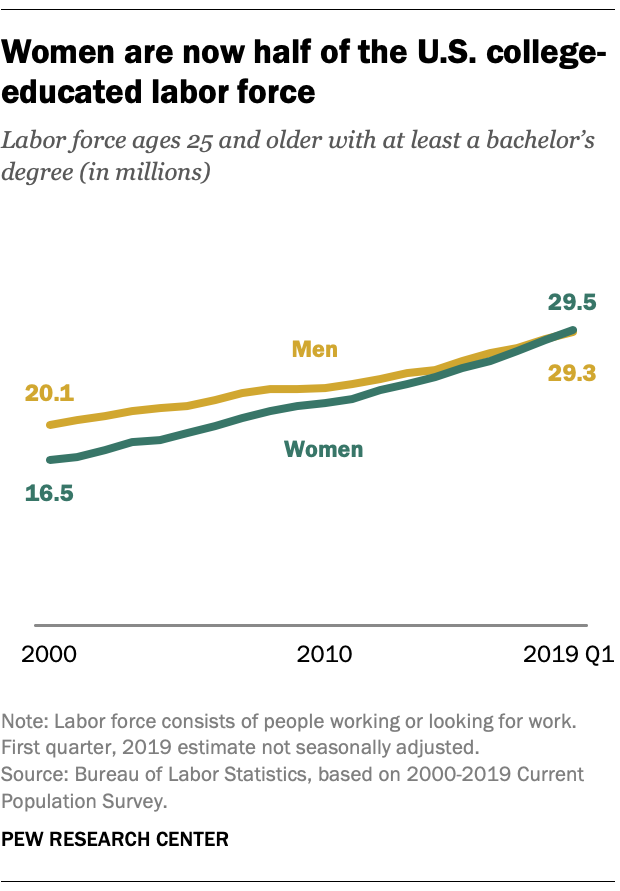
- Line Graphs, time series
- Scatter Plots
- Trend line
- Correlation
- Curves of Best Fit
- Regression Equations
- Linear
- Exponential
- Logarithmic
- Power
Math Activity: Build Basic Charts
Purpose: Explore building charts appropriate to the data.
Materials: Imagination, paper, color.
Directions: Find data for each of the chart types below. For each chart you will need a table to summarize the data, then build the chart. When you are done, take a picture of each page to upload.
Keep in mind that some charts are not appropriate for some data. Proceed with care.
Look through section 7.1 for ideas. Look online for ideas. Look around your house, inside and out. Think about your family and friends. What can you categorize into two or more groups and count? If you do find a good idea online, then personalize it or just reproduce it.

Math Activity: Build a Histogram
Purpose: Explore building a histogram based on a large data set.
Materials: Imagination, paper, color.
Directions: Find or make a data set with at least 30 entries. StatKey has some good data set to think about, or try my 2019 Pendleton or Hermiston home prices.
- Raw data
- Grouping decision 1
- Frequency table 1
- Histogram 1
- Grouping decision 2
- Frequency table 2
- Histogram 2
Math Activity: Build a Scatter Plot and Trend Line
Purpose: Explore bivariate data and correlation.
Materials: Imagination, paper, color.
Directions: Find or make a bivariate data set with at least 10 entries.
StatKey has some good examples, and so does Spurious Correlations but they don't show the table, scatter plot, nor linear model.
- Definitions of each variable
- Table of data
- Scatter plot, well labeled
- Line drawn through points that "fits" trend
- Equation of line
- Is the line a good fit? Why?
- Use the equation to make a prediction? Explain the prediction.
Chapter 7 Statistics
§ 7.2 Describing and Analyzing Data
Descriptive Statistics part 2
- Descriptive Statistics
the science of describing data with charts and summary calculations.
- Measures of Center
- Mean
average = `"sum"/"count"` - Median
middle value when ranked, position = `(n+1)/2`
the value where 50% of the data is less than or equal. - Mode
most frequently occuring
- Mean
- Measures of Spread
- Range = max - min
- Quartiles
The first quartile, `Q_1` is the value where 25% of the data is less than or equal.
The third quartile, `Q_3` is the value where 75% of the data is less than or equal. - InterQuartile Range = `Q_3-Q_1`
- Mean Devation?! Really?!
- Standard Deviation
a measure of average spread from the mean.
- Box and Whisker Plots
a graph of the 5-number summary, min, `Q_1`, median, `Q_3`, max - Outliers
- 1.5 IRQ Rule
- 2 Standard Deviation Rule
- Data Distribution
a graph of description of the center and spread of the data - Spreadsheets
Using spreadsheets to do descriptive statistics.
Chapter 7 Statistics
§ 7.3 Sampling, Predictions, and Simulations
Inferential Statistics
- Sample vs Population
- Statistic vs Parameter
- Random Sampling
each group of size `n` in a population has the same chance of being selected as any other group of size `n`. - Stratified Sampling
- Data Distributions
- Skewed Distributions
The skew is to the tail.
- Symmetrical
mean `~~` median
- Skewed left
mean < median
- Skewed right
mean > median
- Symmetrical
- BiModal

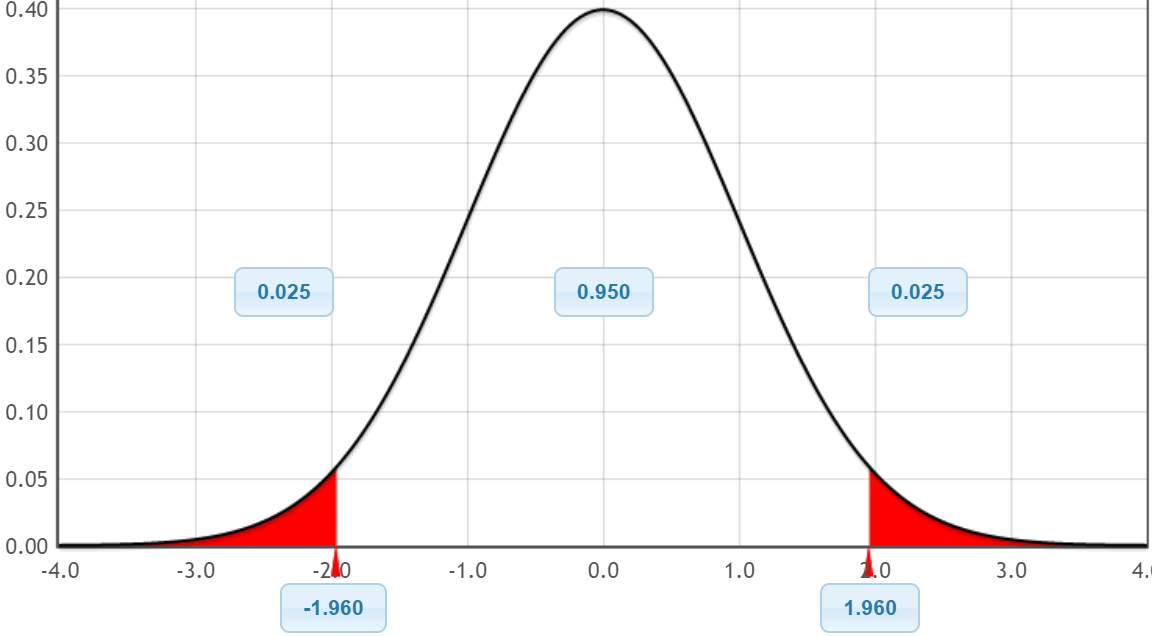
- Bell Shaped

- Normal
- Skewed Distributions
- Measures of Relative Standing
- Percentiles
- z-scores
- Rare events
- Simulations
- Spreadsheet: =RAND(), RANDBETWEEN(0,9)
- Random.org
- StatKey