MTH098 Quant Lit 2

Fun with patterns, formulas, and money.
Module 3
§ 3-1 Seeing Patterns
Specific Objectives
Students will understand
- There are multiple ways to "see" and describe a pattern
Students will be able to
- Form an expression to describe a pattern
- Use that expression to evaluate and solve
Prep
Graphing
- Linear
- Quadratic
- Exponential
- Recognize equation
- Recognize shape
Prep Videos
Lesson
SYW
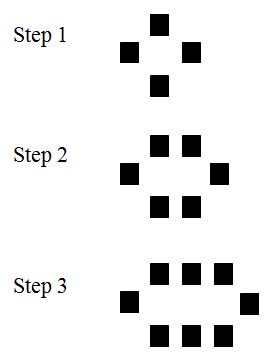
Check out this pattern
Figure 0: 
Figure 1: 
Figure 2: 
§ 3-2 Balancing Blood Alcohol
Specific Objectives
Students will understand that
- the behavior of a formula can be explored using a table and graph.
Students will be able to
- simplify a formula given values for some parameters.
- solve for a variable in a linear equation, and evaluate an equation.
Prep
Lesson
Problem Situation: Calculating Blood Alcohol Content
`BAC = -0.015*"hours"+(2.84*"drinks")/("Weight"*"gender")`
| Hours | Blood Alcohol Content |
|---|---|
| 0 | 0.116 |
| 1 | 0.101 |
| 2 | 0.086 |
| 3 | 0.071 |
| 4 | 0.056 |
| 5 | 0.041 |

Overview Video
HW
BAC is a percentage, the ratio of grams of alcohol to grams of blood. So a BAC of 0.1
(which is above the legal limit to operate a motor vehicle) really means 0.1%.
`0.1%=0.1/100=10/1000`, so for every 1000 grams of blood there are 10 grams of alcohol.
§ 3-3 Lining Up
Specific Objectives
Students will understand that
- linear models are appropriate when the situation has a constant increase/decrease.
- slope is the rate of change.
- the rate of change (slope) has units in context.
- different representations of a linear model can be used interchangeably.
Students will be able to
- label units on variables used in a linear model.
- make a linear model when given data or information in context.
- make a graphical representation of a linear model.
- make a table of values based on a linear relationship.
- identify and interpret the vertical intercept in context.
Prep
- Four Representations of a Relationship
- Slope
- Slope-Intercept Equation
- Rates of Change
Videos
Determine the Slope Given the Graph of a Line (negative slope)
Slope Application Involving Production Costs
Lesson
Problem Situation 1: T-Shirt Sales
A sports team is planning a fundraiser to help pay for equipment. Their plan is to sell team T-shirts to friends and family, and they hope to raise $500. Their local screen printing shop will charge them a $75 setup fee, plus $6 per shirt, and they plan to sell the shirts for $15 each.
§ 3.4 Comparing Change
Specific Objectives
Students will understand that
- that linear models are appropriate when the situation has a constant rate of increase/decrease or can be approximated by a constant rate.
- that the rate of change (slope) has units in context.
- the difference between a positive slope and a negative slope.
- that the linear models for authentic situations have limitations in using them to make predictions.
Students will be able to
- make a linear model when given data or information in context.
- calculate a slope given data or information in context.
- estimate and calculate the value that makes two linear models equivalent.
Prep
- Linear Equations
- Identify Slope
- Identify intercepts
Videos
Lesson
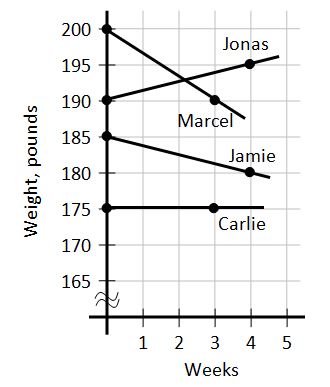
Problem Situation 1: Weight Loss Challenge
Four friends decided to do a joint weight loss challenge. They weighed in at the start, and again after 3 or 4 weeks.
Problem Situation 2: Milk and Soft Drink Consumption
Since 1950, the U.S. per-person consumption of milk and soft drinks has changed drastically. For example, in 1950, the number of gallons of milk consumed per person was 36.4 gallons; in 2000 that number had decreased to 22.6 gallons. Meanwhile, the number of gallons of soft drinks consumed per person in 1950 was 10.8 gallons. By 2000, this number had increased to 49.3 gallons per person.

§ 3-5 That Is Close Enough
Specific Objectives
Students will understand that
- linear equations can approximate nearly linear data.
Students will be able to
- find the equation of a line that estimates nearly linear data by calculating the rate of change and the vertical intercept of the line.
- use approximate linear models to interpolate and extrapolate.
Prep
- Find the slope of a line through two points.
- Find the equation of a line through two points.
Videos
Lesson
https://youtu.be/Zf9iSAquZTMVideos
Problem Situation 1: Minimum Wage
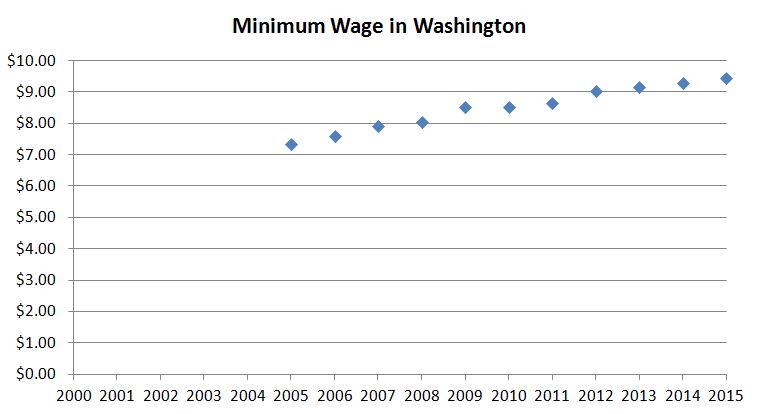
Consider the minimum wage data from Washington state. Use the value from the years 2005 and 2015 to find a linear equation for years after 2000.
Problem Situation 1: Height Chart
The chart to the below is a growth chart for boys, aged 2 to 15 years. The different curves show different percentiles for growth; the top curve shows the 95th percentile, where 95% of boys are that height or shorter. The middle curve shows the 50th percentile (the median height), and the bottom curve shows the 5th percentile.

Use the median height for ages 3 and 15 to find a linear model for the hight H in terms of the age t.
§ ?-? Title
Specific Objectives
Students will understand that
- Item
Students will be able to
- Item
Prep
- Item
Videos
Lesson
Module 4
§ 4-1 Compounding Interest Makes Cents
Specific Objectives
Students will understand that
- Item
Students will be able to
- Item
Prep
- Item
Videos
Lesson
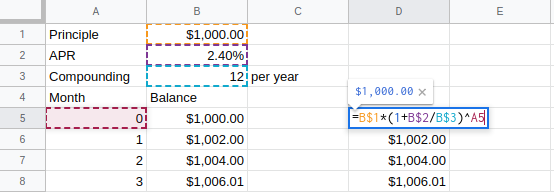
Problem Situation: Calculate Value of a Five-Year CD
Suppose you invest $1,000 principal in a two-year CD, advertised with an annual percentage rate (APR) of 2.4%, where compounding occurs monthly.
`I=P*r*t`
| Term | Calculation | Account Balance |
|---|---|---|
| 1 year | ||
| 2 years | ||
| 3 years | ||
| 4 years | ||
| 5 years |